Smarter Money Concepts - FVGs [PhenLabs]📊 Smarter Money Concepts - FVGs
Version: PineScript™ v6
📌 Description
Smarter Money Concepts - FVGs is a sophisticated indicator designed to identify and track Fair Value Gaps (FVGs) in price action. These gaps represent market inefficiencies where price moves quickly, creating imbalances that often attract subsequent price action for mitigation. By highlighting these key areas, traders can identify potential zones for reversals, continuations, and price targets.
The indicator employs volume filtering ideology to highlight only the most significant FVGs, reducing noise and focusing on gaps formed during periods of higher relative volume. This combination of price structure analysis and volume confirmation provides traders with high-probability areas of interest that institutional smart money may target during future price movements.
🚀 Points of Innovation
Volume-Filtered Gap Detection : Eliminates low-significance FVGs by requiring a minimum volume threshold, focusing only on gaps formed with institutional participation
Equilibrium Line Visualization : Displays the midpoint of each gap as a potential precision target for trades
Automated Gap Mitigation Tracking : Monitors when price revisits and mitigates gaps, automatically managing visual elements
Time-Based Gap Management : Intelligently filters gaps based on a configurable timeframe, maintaining chart clarity
Dual Direction Analysis : Simultaneously tracks both bullish and bearish gaps, providing a complete market structure view
Memory-Optimized Design : Implements efficient memory management for smooth chart performance even with numerous FVGs
🔧 Core Components
Fair Value Gap Detection : Identifies price inefficiencies where the current candle’s low is higher than the previous candle’s high (bearish FVG) or where the current candle’s high is lower than the previous candle’s low (bullish FVG).
Volume Filtering Mechanism : Calculates relative volume compared to a moving average to qualify only gaps formed during significant market activity.
Mitigation Tracking : Continuously monitors price action to detect when gaps get filled, with options to either hide or maintain visual representation of mitigated gaps.
🔥 Key Features
Customizable Gap Display : Toggle visibility of bullish and bearish gaps independently to focus on your preferred market direction
Volume Threshold Control : Adjust the minimum volume ratio required for gap qualification, allowing fine-tuning between sensitivity and significance
Flexible Mitigation Methods : Choose between “Wick” or “Close” methods for determining when a gap has been mitigated, adapting to different trading styles
Visual Customization : Full control over colors, transparency, and style of gap boxes and equilibrium lines
🎨 Visualization
Gap Boxes : Rectangular highlights showing the exact price range of each Fair Value Gap. Bullish gaps indicate potential upward price targets, while bearish gaps show potential downward targets.
Equilibrium Lines : Dotted lines running through the center of each gap, representing the mathematical midpoint that often serves as a precision target for price movement.
📖 Usage Guidelines
General Settings
Days to Analyze : Default: 15, Range: 1-100. Controls how many days of historical gaps to display, balancing between comprehensive analysis and chart clarity
Visual Settings
Bull Color : Default:(#596fd33f). Color for bullish Fair Value Gaps, typically using high transparency for clear chart visibility
Bear Color : Default:(#d3454575). Color for bearish Fair Value Gaps, typically using high transparency for clear chart visibility
Equilibrium Line : Default: Enabled. Toggles visibility of the center equilibrium line for each FVG
Eq. Line Color : Default: Black with 99% transparency. Sets the color of equilibrium lines, usually kept subtle to avoid chart clutter
Eq. Line Style : Default: Dotted, Options: Dotted, Solid, Dashed. Determines the line style for equilibrium lines
Mitigation Settings
Mitigation Method : Default: Wick, Options: Wick, Close. Determines how gap mitigation is calculated - “Wick” uses high/low values while “Close” uses open/close values for more conservative mitigation criteria
Hide Mitigated : Default: Enabled. When enabled, gaps become transparent once mitigated, reducing visual clutter while maintaining historical context
Volume Filter
Volume Filter : Default: Enabled. When enabled, only shows gaps formed with significant volume relative to recent average
Min Ratio : Default: 1.5, Range: 0.1-10.0. Minimum volume ratio compared to average required to display an FVG; higher values filter out more gaps
Periods : Default: 15, Range: 5-50. Number of periods used to calculate the average volume baseline
✅ Best Use Cases
Identifying potential reversal zones where price may react after extended moves
Finding precise targets for take-profit placement in trend-following strategies
Detecting institutional interest areas for potential breakout or breakdown confirmations
Plotting significant support and resistance zones based on structural imbalances
Developing fade strategies at key market structure points
Confirming trade entries when price approaches significant unfilled gaps
⚠️ Limitations
Works best on higher timeframes where gaps reflect more significant market inefficiencies
Very choppy or ranging markets may produce small gaps with limited predictive value
Volume filtering depends on accurate volume data, which may be less reliable for some symbols
Performance may be affected when displaying a very large number of historical gaps
Some gaps may never be fully mitigated, particularly in strongly trending markets
💡 What Makes This Unique
Volume Intelligence : Unlike basic FVG indicators, this script incorporates volume analysis to identify the most significant structural imbalances, focusing on quality over quantity.
Visual Clarity Management : Automatic handling of mitigated gaps and memory management ensures your chart remains clean and informative even over extended analysis periods.
Dual-Direction Comprehensive Analysis : Simultaneously tracks both bullish and bearish gaps, providing a complete market structure picture rather than forcing a directional bias.
🔬 How It Works
1. Gap Detection Process :
The indicator examines each candle in relation to previous candles, identifying when a gap forms between the low of candle and high of candle (bearish FVG) or between the high of candle and low of candle (bullish FVG). This specific candle relationship identifies true structural imbalances.
2. Volume Qualification :
For each potential gap, the algorithm calculates the relative volume compared to the configured period average. Only gaps formed with volume exceeding the minimum ratio threshold are displayed, ensuring focus on institutionally significant imbalances.
3. Equilibrium Calculation :
For each qualified gap, the script calculates the precise mathematical midpoint, which becomes the equilibrium line - a key target that price often gravitates toward during mitigation attempts.
4. Mitigation Tracking :
The indicator continuously monitors price action against existing gaps, determining mitigation based on the selected method (wick or close). When price reaches the equilibrium point, the gap is considered mitigated and can be visually updated accordingly.
💡 Note:
Fair Value Gaps represent market inefficiencies that often, but not always, get filled. Use this indicator as part of a complete trading strategy rather than as a standalone system. The most valuable signals typically come from combining FVG analysis with other confirmatory indicators and overall market context. For optimal results, start with the default settings and gradually adjust parameters to match your specific trading timeframe and style.
在腳本中搜尋"smart money"

02 SMC + BB Breakout (Improved)This strategy combines Smart Money Concepts (SMC) with Bollinger Band breakouts to identify potential trading opportunities. SMC focuses on identifying key price levels and market structure shifts, while Bollinger Bands help pinpoint overbought/oversold conditions and potential breakout points. The strategy also incorporates higher timeframe trend confirmation to filter out trades that go against the prevailing trend.
Key Components:
Bollinger Bands:
Calculated using a Simple Moving Average (SMA) of the closing price and a standard deviation multiplier.
The strategy uses the upper and lower bands to identify potential breakout points.
The SMA (basis) acts as a centerline and potential support/resistance level.
The fill between the upper and lower bands can be toggled by the user.
Higher Timeframe Trend Confirmation:
The strategy allows for optional confirmation of the current trend using a higher timeframe (e.g., daily).
It calculates the SMA of the higher timeframe's closing prices.
A bullish trend is confirmed if the higher timeframe's closing price is above its SMA.
This helps filter out trades that go against the prevailing long-term trend.
Smart Money Concepts (SMC):
Order Blocks:
Simplified as recent price clusters, identified by the highest high and lowest low over a specified lookback period.
These levels are considered potential areas of support or resistance.
Liquidity Zones (Swing Highs/Lows):
Identified by recent swing highs and lows, indicating areas where liquidity may be present.
The Swing highs and lows are calculated based on user defined lookback periods.
Market Structure Shift (MSS):
Identifies potential changes in market structure.
A bullish MSS occurs when the closing price breaks above a previous swing high.
A bearish MSS occurs when the closing price breaks below a previous swing low.
The swing high and low values used for the MSS are calculated based on the user defined swing length.
Entry Conditions:
Long Entry:
The closing price crosses above the upper Bollinger Band.
If higher timeframe confirmation is enabled, the higher timeframe trend must be bullish.
A bullish MSS must have occurred.
Short Entry:
The closing price crosses below the lower Bollinger Band.
If higher timeframe confirmation is enabled, the higher timeframe trend must be bearish.
A bearish MSS must have occurred.
Exit Conditions:
Long Exit:
The closing price crosses below the Bollinger Band basis.
Or the Closing price falls below 99% of the order block low.
Short Exit:
The closing price crosses above the Bollinger Band basis.
Or the closing price rises above 101% of the order block high.
Position Sizing:
The strategy calculates the position size based on a fixed percentage (5%) of the strategy's equity.
This helps manage risk by limiting the potential loss per trade.
Visualizations:
Bollinger Bands (upper, lower, and basis) are plotted on the chart.
SMC elements (order blocks, swing highs/lows) are plotted as lines, with user-adjustable visibility.
Entry and exit signals are plotted as shapes on the chart.
The Bollinger band fill opacity is adjustable by the user.
Trading Logic:
The strategy aims to capitalize on Bollinger Band breakouts that are confirmed by SMC signals and higher timeframe trend. It looks for breakouts that align with potential market structure shifts and key price levels (order blocks, swing highs/lows). The higher timeframe filter helps avoid trades that go against the overall trend.
In essence, the strategy attempts to identify high-probability breakout trades by combining momentum (Bollinger Bands) with structural analysis (SMC) and trend confirmation.
Key User-Adjustable Parameters:
Bollinger Bands Length
Standard Deviation Multiplier
Higher Timeframe
Higher Timeframe Confirmation (on/off)
SMC Elements Visibility (on/off)
Order block lookback length.
Swing lookback length.
Bollinger band fill opacity.
This detailed description should provide a comprehensive understanding of the strategy's logic and components.
***DISCLAIMER: This strategy is for educational purposes only. It is not financial advice. Past performance is not indicative of future results. Use at your own risk. Always perform thorough backtesting and forward testing before using any strategy in live trading.***

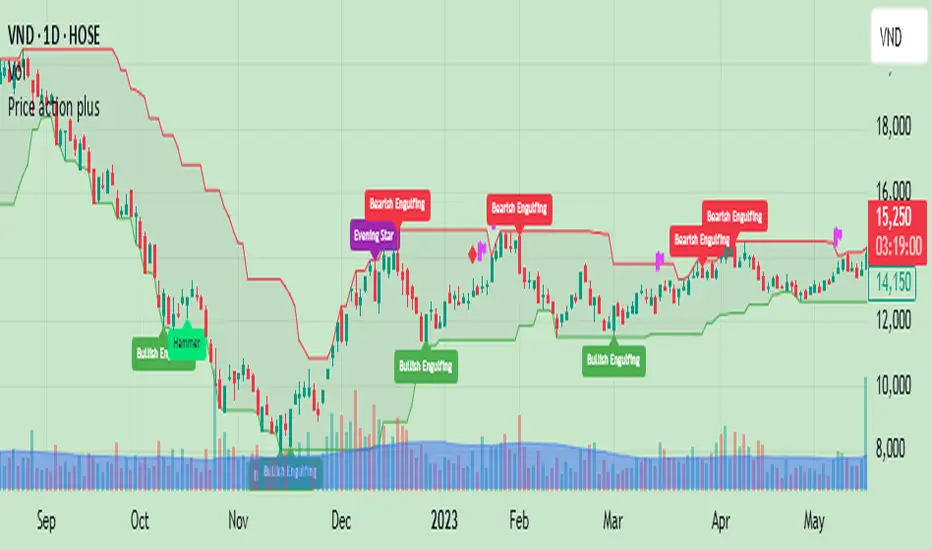
Price action plus//The system combines the divergence of A/D and OBV with identifying reversal points using Japanese candlestick patterns, creating an enhanced version of price action. This helps investors more easily and accurately recognize reversal patterns in technical analysis.
Divergence of A/D vs. OBV includes:
Positive divergence: Identifies smart money leaving the market.
Negative divergence: Identifies smart money entering the market.
Reversal candlestick patterns include:
Buy signals: Morning Star, Bullish Engulfing, Hammer.
Strong Buy signals: Buy signals + Negative divergence
Sell signals: Evening Star, Bearish Engulfing, Shooting Star.
Strong Sell signals : Sell signals + Positive divergence
//Hope this system will be helpful for you!
ICT FVG & Swing Detector Basic by Trader RiazICT FVG & Swing Detector Basic by Trader Riaz
Unlock Precision Trading with the Ultimate Fair Value Gap (FVG) and Swing Detection Tool!
Developed by Trader Riaz , the ICT FVG and Swing Detector Basic is a powerful Pine Script indicator designed to help traders identify key market structures with ease. Whether you're a day trader, swing trader, or scalper, this indicator provides actionable insights by detecting Bullish and Bearish Fair Value Gaps (FVGs) and Swing Highs/Lows on any timeframe. Perfect for trading forex, stocks, crypto, and more on TradingView!
Key Features:
1: Bullish and Bearish FVG Detection
- Automatically identifies Bullish FVGs (highlighted in green) and Bearish FVGs (highlighted in red) to spot potential reversal or continuation zones.
- Displays FVGs as shaded boxes with a dashed midline at 70% opacity, making it easy to see the midpoint of the gap for precise entries and exits.
- Labels are placed inside the FVG boxes at the extreme right for clear visibility.
2: Customizable FVG Display
- Control the number of Bullish and Bearish FVGs displayed on the chart with user-defined inputs (fvg_bull_count and fvg_bear_count).
- Toggle the visibility of Bullish and Bearish FVGs with simple checkboxes (show_bull_fvg and show_bear_fvg) to declutter your chart.
3: Swing High and Swing Low Detection
- Detects Swing Highs (blue lines) and Swing Lows (red lines) to identify key market turning points.
- Labels are positioned at the extreme right edge of the lines for better readability and alignment.
- Customize the number of Swing Highs and Lows displayed (swing_high_count and swing_low_count) to focus on the most recent market structures.
4: Fully Customizable Display
- Toggle visibility for Swing Highs and Lows (show_swing_high and show_swing_low) to suit your trading style.
- Adjust the colors of Swing High and Low lines (swing_high_color and swing_low_color) to match your chart preferences.
5: Clean and Efficient Design
- Built with Pine Script v6 for optimal performance on TradingView.
- Automatically removes older FVGs and Swing points when the user-defined count is exceeded, keeping your chart clean and focused.
- Labels are strategically placed to avoid clutter while providing clear information.
Why Use This Indicator?
Precision Trading: Identify high-probability setups with FVGs and Swing points, commonly used in Smart Money Concepts (SMC) and Institutional Trading strategies.
User-Friendly: Easy-to-use inputs allow traders of all levels to customize the indicator to their needs.
Versatile: Works on any market (Forex, Stocks, Crypto, Commodities) and timeframe (1M, 5M, 1H, 4H, Daily, etc.).
Developed by Trader Riaz: Backed by the expertise of Trader Riaz, a seasoned trader dedicated to creating tools that empower the TradingView community.
How to Use:
- Add the Custom FVG and Swing Detector to your chart on TradingView.
- Adjust the input settings to control the number of FVGs and Swing points displayed.
- Toggle visibility for Bullish/Bearish FVGs and Swing Highs/Lows as needed.
- Use the identified FVGs and Swing points to plan your trades, set stop-losses, and target key levels.
Ideal For:
- Traders using Smart Money Concepts (SMC), Price Action, or Market Structure strategies.
- Those looking to identify liquidity grabs, imbalances, and trend reversals.
- Beginners and advanced traders seeking a reliable tool to enhance their technical analysis.
Happy trading!

VSA Vol Key VSA Signals
(1) No Demand – Bearish Signal
Low volume, narrow spread.
Price rises, but volume does not increase → Weak market, lack of buyers.
If this appears in an uptrend, it may indicate a potential reversal.
(2) No Supply – Bullish Signal
Low volume, narrow spread.
Price declines, but volume does not increase → Weak selling pressure.
If this appears in an uptrend, it may confirm the continuation of the uptrend.
(3) Stopping Volume – Bullish Reversal Signal
Strong price decline, but unusually high volume.
Candle shows a long lower wick, closing near the top.
Indicates Smart Money absorbing supply, signaling a potential reversal upwards.
(4) Climactic Volume – Possible Trend Reversal
Extremely high volume with a sharp price increase or decrease.
If this occurs after a long trend, it may indicate a trend reversal.
Smart Money may be taking profits after a prolonged price movement.
(5) Effort vs. Result
If volume is high but price movement is weak → Inefficient buying/selling, possible reversal.
If volume is high and price moves strongly in the same direction → Trend is likely to continue.

Quantum Motion Oscillator-QMO (TechnoBlooms)Quantum Motion Oscillator (QMO) is a momentum indicator designed for traders who demand precision. Combining multi-timeframe weighted linear regression with EMA crossovers, QMO offers a dynamic view of market momentum, helping traders anticipate trend shifts with greater accuracy.
This oscillator is inspired by quantum mechanics and wave theory, where market movement is seen as a series of probabilistic waves rather than rigid structures.
The histogram is plotted in proportion to the price movement of the candlesticks.
KEY FEATURES
1. Multi-Timeframe Histogram - Integrates 1 to 5 weighted linear regression averages, reducing lag while maintaining accuracy.
2. EMA Crossover Signal - Uses a Short and Long EMA to confirm trend shifts with minimal noise.
3. Adaptive Trend Analysis - Self-adjusting mechanics make QMO effective in both ranging and trending markets.
4. Scalable for Different Trading Styles - Works seamlessly for scalping, intraday, swing and position trading.
ADVANCED PROFESSIONAL INSIGHTS
1. Wave Dynamics and Market Flow - Inspired by wave mechanics, QMO reflects the energy accumulation and dissipation in price movements.
Expanding histogram waves = Strong momentum surge
Contracting waves = Momentum weakening, potential reversal zone.
2. Liquidity and Order Flow Applications - QMO works well alongside liquidity concepts and smart money techniques:
Combine with Fair Value Gaps & Order Blocks -> Enter when QMO signals align with liquidity zones.
Avoid False Moves - If price sweeps liquidity, but QMO momentum diverges, it is a sign of potential smart money manipulation.

Enhanced KLSE Banker Flow Oscillator# Enhanced KLSE Banker Flow Oscillator
## Description
The Enhanced KLSE Banker Flow Oscillator is a sophisticated technical analysis tool designed specifically for the Malaysian stock market (KLSE). This indicator analyzes price and volume relationships to identify potential smart money movements, providing early signals for market reversals and continuation patterns.
The oscillator measures the buying and selling pressure in the market with a focus on detecting institutional activity. By combining money flow calculations with volume filters and price action analysis, it helps traders identify high-probability trading opportunities with reduced noise.
## Key Features
- Dual-Timeframe Analysis: Combines long-term money flow trends with short-term momentum shifts for more accurate signals
- Adaptive Volume Filtering: Automatically adjusts volume thresholds based on recent market conditions
- Advanced Divergence Detection: Identifies potential trend reversals through price-flow divergences
- Early Signal Detection: Provides anticipatory signals before major price movements occur
- Multiple Signal Types: Offers both early alerts and strong confirmation signals with clear visual markers
- Volatility Adjustment: Adapts sensitivity based on current market volatility for more reliable signals
- Comprehensive Visual Feedback: Color-coded oscillator, signal markers, and optional text labels
- Customizable Display Options: Toggle momentum histogram, early signals, and zone fills
- Organized Settings Interface: Logically grouped parameters for easier configuration
## Indicator Components
1. Main Oscillator Line: The primary banker flow line that fluctuates above and below zero
2. Early Signal Line: Secondary indicator showing potential emerging signals
3. Momentum Histogram: Visual representation of flow momentum changes
4. Zone Fills: Color-coded background highlighting positive and negative zones
5. Signal Markers: Visual indicators for entry and exit points
6. Reference Lines: Key levels for strong and early signals
7. Signal Labels: Optional text annotations for significant signals
## Signal Types
1. Strong Buy Signal (Green Arrow): Major bullish signal with high probability of success
2. Strong Sell Signal (Red Arrow): Major bearish signal with high probability of success
3. Early Buy Signal (Blue Circle): First indication of potential bullish trend
4. Early Sell Signal (Red Circle): First indication of potential bearish trend
5. Bullish Divergence (Yellow Triangle Up): Price making lower lows while flow makes higher lows
6. Bearish Divergence (Yellow Triangle Down): Price making higher highs while flow makes lower highs
## Parameters Explained
### Core Settings
- MFI Base Length (14): Primary calculation period for money flow index
- Short-term Flow Length (5): Calculation period for early signals
- KLSE Sensitivity (1.8): Multiplier for flow calculations, higher = more sensitive
- Smoothing Length (5): Smoothing period for the main oscillator line
### Volume Filter Settings
- Volume Filter % (65): Minimum volume threshold as percentage of average
- Use Adaptive Volume Filter (true): Dynamically adjusts volume thresholds
### Signal Levels
- Strong Signal Level (15): Threshold for strong buy/sell signals
- Early Signal Level (10): Threshold for early buy/sell signals
- Early Signal Threshold (0.75): Sensitivity factor for early signals
### Advanced Settings
- Divergence Lookback (34): Period for checking price-flow divergences
- Show Signal Labels (true): Toggle text labels for signals
### Visual Settings
- Show Momentum Histogram (true): Toggle the momentum histogram display
- Show Early Signal (true): Toggle the early signal line display
- Show Zone Fills (true): Toggle background color fills
## How to Use This Indicator
### Installation
1. Add the indicator to your TradingView chart
2. Default settings are optimized for KLSE stocks
3. Customize parameters if needed for specific stocks
### Basic Interpretation
- Oscillator Above Zero: Bullish bias, buying pressure dominates
- Oscillator Below Zero: Bearish bias, selling pressure dominates
- Crossing Zero Line: Potential shift in market sentiment
- Extreme Readings: Possible overbought/oversold conditions
### Advanced Interpretation
- Divergences: Early warning of trend exhaustion
- Signal Confluences: Multiple signal types appearing together increase reliability
- Volume Confirmation: Signals with higher volume are more significant
- Momentum Alignment: Histogram should confirm direction of main oscillator
### Trading Strategies
#### Trend Following Strategy
1. Identify market trend direction
2. Wait for pullbacks shown by oscillator moving against trend
3. Enter when oscillator reverses back in trend direction with a Strong signal
4. Place stop loss below/above recent swing low/high
5. Take profit at previous resistance/support levels
#### Counter-Trend Strategy
1. Look for oscillator reaching extreme levels
2. Identify divergence between price and oscillator
3. Wait for oscillator to cross Early signal threshold
4. Enter position against prevailing trend
5. Use tight stop loss (1 ATR from entry)
6. Take profit at first resistance/support level
#### Breakout Confirmation Strategy
1. Identify stock consolidating in a range
2. Wait for price to break out of range
3. Confirm breakout with oscillator crossing zero line in breakout direction
4. Enter position in breakout direction
5. Place stop loss below/above the breakout level
6. Trail stop as price advances
### Signal Hierarchy and Reliability
From highest to lowest reliability:
1. Strong Buy/Sell signals with divergence and high volume
2. Strong Buy/Sell signals with high volume
3. Divergence signals followed by Early signals
4. Strong Buy/Sell signals with normal volume
5. Early Buy/Sell signals with high volume
6. Early Buy/Sell signals with normal volume
## Complete Trading Plan Example
### KLSE Market Trading System
#### Pre-Trading Preparation
1. Review overall market sentiment (bullish, bearish, or neutral)
2. Scan for stocks showing significant banker flow signals
3. Note key support/resistance levels for watchlist stocks
4. Prioritize trade candidates based on signal strength and volume
#### Entry Rules for Long Positions
1. Banker Flow Oscillator above zero line (positive flow environment)
2. One or more of the following signals present:
- Strong Buy signal (green arrow)
- Bullish Divergence signal (yellow triangle up)
- Early Buy signal (blue circle) with confirming price action
3. Entry confirmation requirements:
- Volume above 65% of 20-day average
- Price above short-term moving average (e.g., 20 EMA)
- No immediate resistance within 3% of entry price
4. Entry on the next candle open after signal confirmation
#### Entry Rules for Short Positions
1. Banker Flow Oscillator below zero line (negative flow environment)
2. One or more of the following signals present:
- Strong Sell signal (red arrow)
- Bearish Divergence signal (yellow triangle down)
- Early Sell signal (red circle) with confirming price action
3. Entry confirmation requirements:
- Volume above 65% of 20-day average
- Price below short-term moving average (e.g., 20 EMA)
- No immediate support within 3% of entry price
4. Entry on the next candle open after signal confirmation
#### Position Sizing Rules
1. Base risk per trade: 1% of trading capital
2. Position size calculation: Capital × Risk% ÷ Stop Loss Distance
3. Position size adjustments:
- Increase by 20% for Strong signals with above-average volume
- Decrease by 20% for Early signals without confirming price action
- Standard size for all other valid signals
#### Stop Loss Placement
1. For Long Positions:
- Place stop below the most recent swing low
- Minimum distance: 1.5 × ATR(14)
- Maximum risk: 1% of trading capital
2. For Short Positions:
- Place stop above the most recent swing high
- Minimum distance: 1.5 × ATR(14)
- Maximum risk: 1% of trading capital
#### Take Profit Strategy
1. First Target (33% of position):
- 1.5:1 reward-to-risk ratio
- Move stop to breakeven after reaching first target
2. Second Target (33% of position):
- 2.5:1 reward-to-risk ratio
- Trail stop at previous day's low/high
3. Final Target (34% of position):
- 4:1 reward-to-risk ratio or
- Exit when opposing signal appears (e.g., Strong Sell for long positions)
#### Trade Management Rules
1. After reaching first target:
- Move stop to breakeven
- Consider adding to position if new confirming signal appears
2. After reaching second target:
- Trail stop using banker flow signals
- Exit remaining position when:
- Oscillator crosses zero line in opposite direction
- Opposing signal appears
- Price closes below/above trailing stop level
3. Maximum holding period:
- 20 trading days for trend-following trades
- 10 trading days for counter-trend trades
- Re-evaluate if targets not reached within timeframe
#### Risk Management Safeguards
1. Maximum open positions: 5 trades
2. Maximum sector exposure: 40% of trading capital
3. Maximum daily drawdown limit: 3% of trading capital
4. Mandatory stop trading rules:
- After three consecutive losing trades
- After reaching 5% account drawdown
- Resume after two-day cooling period and strategy review
#### Performance Tracking
1. Track for each trade:
- Signal type that triggered entry
- Oscillator reading at entry and exit
- Volume relative to average
- Price action confirmation patterns
- Holding period
- Reward-to-risk achieved
2. Review performance metrics weekly:
- Win rate by signal type
- Average reward-to-risk ratio
- Profit factor
- Maximum drawdown
3. Adjust strategy parameters based on performance:
- Increase position size for highest performing signals
- Decrease or eliminate trades based on underperforming signals
## Advanced Usage Tips
1. Combine with Support/Resistance:
- Signals are more reliable when they occur at key support/resistance levels
- Look for banker flow divergence at major price levels
2. Multiple Timeframe Analysis:
- Use the oscillator on both daily and weekly timeframes
- Stronger signals when both timeframes align
- Enter on shorter timeframe when confirmed by longer timeframe
3. Sector Rotation Strategy:
- Compare banker flow across different sectors
- Rotate capital to sectors showing strongest positive flow
- Avoid sectors with persistent negative flow
4. Volatility Adjustments:
- During high volatility periods, wait for Strong signals only
- During low volatility periods, Early signals can be more actionable
5. Optimizing Parameters:
- For more volatile stocks: Increase Smoothing Length (6-8)
- For less volatile stocks: Decrease KLSE Sensitivity (1.2-1.5)
- For intraday trading: Reduce all length parameters by 30-50%
## Fine-Tuning for Different Markets
While optimized for KLSE, the indicator can be adapted for other markets:
1. For US Stocks:
- Reduce KLSE Sensitivity to 1.5
- Increase Volume Filter to 75%
- Adjust Strong Signal Level to 18
2. For Forex:
- Increase Smoothing Length to 8
- Reduce Early Signal Threshold to 0.6
- Focus more on divergence signals than crossovers
3. For Cryptocurrencies:
- Increase KLSE Sensitivity to 2.2
- Reduce Signal Levels (Strong: 12, Early: 8)
- Use higher Volume Filter (80%)
By thoroughly understanding and properly implementing the Enhanced KLSE Banker Flow Oscillator, traders can gain a significant edge in identifying institutional money flow and making more informed trading decisions, particularly in the Malaysian stock market.

POC-Candle-EMA-ATR-LongShadow-50percCandleThis is a script for those who trade based on volume and smart money strategies.
Some of the features of this script:
- Display "Time Price Opportunity Chart". These points help traders to identify price opportunities over time and have a better analysis of the market.
- Mark candles that have traded more volume than previous candles.
- Mark candles whose body is at least and not more than 50% of the total candle size, these candles can be found more easily in smart money strategies.
- Mark spike candles to find FVG faster
- Mark candles that have a shadow of at least more than 380 points and can be good reversal points.
- EMA indicator to check the market trend
- DonchianChannel indicator to check the price trend on the chart
Regards

Crystal Order BlockThe Crystal Order Block Indicator is a powerful tool designed to help traders identify key institutional order blocks with high precision. This indicator is ideal for traders following Smart Money Concepts (SMC) and Institutional Trading Strategies, providing clear insights into potential high-probability trade setups.
🔹 Key Features:
✔ Automatic Order Block Detection: Identifies valid bullish & bearish order blocks.
✔ Unmitigated Order Blocks Highlighted: Focuses on fresh order blocks for improved trade opportunities.
✔ Trend-Focused Trading: Works best when combined with market structure analysis.
✔ Multi-Timeframe Support: Suitable for scalping, swing trading, and intraday trading.
✔ Risk Management Enhancement: Helps traders refine entries and exits based on institutional price movements.
📈 How to Use the Crystal Order Block Indicator:
🔹 Identifying Order Blocks:
➡ The indicator automatically detects order blocks formed by institutional trading activity.
➡ Unmitigated order blocks are highlighted, indicating areas where price may react.
🔹 High-Probability Trade Setups:
➡ Buy Setup: Look for a bullish order block in an uptrend, confirming strength.
➡ Sell Setup: Identify a bearish order block in a downtrend for potential short trades.
🔹 Order Block Mitigation:
➡ The updated version filters out mitigated order blocks, allowing traders to focus on fresh trading opportunities.
📊 Best Practices & Timeframes:
🔸 Works on all timeframes, but higher accuracy is observed on M30 and above.
🔸 Best suited for Smart Money Trading, Institutional Trading, and Price Action Strategies.
🔸 Should be used with liquidity concepts and market structure analysis for enhanced precision.
⚠ Important Note:
This indicator is a technical tool designed to assist traders in market analysis. It does not guarantee success and should be used alongside proper risk management and trading discipline.

Trading Sessions Highs/Lows | InvrsROBINHOODTrading Sessions Highs/Lows | InvrsROBINHOOD
🚀 A powerful indicator for tracking key trading sessions and the highs and lows of each session!
📌 Description
The Trading Sessions Highs/Lows indicator visually marks the most critical trading sessions—Asia, London, and New York—using small colored dots at the bottom of the candle. It also tracks and plots the highs and lows of each session, along with the Daily Open and Weekly Open levels.
This tool is designed to help traders identify session-based liquidity zones, price reactions, and potential trade setups with minimal chart clutter.
Key Features:
✅ Session markers (Asia, London, NY AM, NY Lunch, NY PM) plotted as small dots
✅ Plots session highs and lows for market structure insights
✅ Daily Open line for intraday reference
✅ Weekly Open line for higher timeframe bias
✅ Alerts for session high/low breaks to capture momentum shifts
✅ User-defined UTC offset for global traders
✅ Customizable session colors for personal preference
📖 How to Use the Indicator
1️⃣ Understanding the Sessions
Asia Session (Yellow Dot) → Marks liquidity buildup & pre-London moves
London Session (Blue Dot) → Strong volatility, breakout opportunities
New York AM Session (Green Dot) → Major trends & institutional participation
New York Lunch (Red Dot) → Low volume, ranging market
New York PM Session (Dark Green Dot) → End-of-day movements & reversals
2️⃣ Session Highs & Lows for Market Structure
Session Highs can act as resistance or breakout points.
Session Lows can act as support or stop-hunt zones.
Break of a session high/low with volume may indicate continuation or reversal.
3️⃣ Using the Daily & Weekly Open
The Daily Open (Black Line) helps gauge the intraday trend.
Above Daily Open → Bearish Bias
Below Daily Open → Bullish Bias
The Weekly Open (Red Line) sets the higher timeframe directional bias.
4️⃣ Alerts for Breakouts
The indicator will trigger alerts when price breaks session highs or lows.
Useful for setting stop-losses, breakout trades, and risk management.
💡 Why This Indicator is Important for Beginners
1️⃣ Avoids Overtrading:
Many beginners trade in low-volume periods (NY Lunch, Asia session) and get stuck in choppy price action.
This indicator highlights when volatility is high so traders focus on better opportunities.
2️⃣ Session-Based Liquidity Traps:
Market makers often run stops at session highs/lows before reversing.
Watching session breaks prevents traders from falling into liquidity grabs.
3️⃣ Reduces Emotional Trading:
If price is above the Daily Open, a beginner shouldn’t look for shorts.
If price is below a key session low, it may signal a fake breakout.
4️⃣ Aligns with Institutional Trading:
Smart money traders use session highs/lows to set stop hunts & reversals.
Beginners can use this indicator to spot these zones before entering trades.
🛡️ How to Mitigate Risk with This Indicator
✅ Wait for Confirmations – Don’t trade blindly at session highs/lows. Look for wicks, rejections, or break/retests.
✅ Use Stop-Loss Above/Below Session Levels – If you’re going long, set SL below a session low. If short, set SL above a session high.
✅ Watch Volume & News Events – Breakouts without strong volume or news may be fake moves.
✅ Combine with Other Strategies – Use price action, trendlines, or EMAs with this indicator for higher probability trades.
✅ Use the Weekly Open for Trend Bias – If price stays below the Weekly Open, avoid bullish setups unless key support holds.
🎯 Who is This Indicator For?
📌 Beginners who need clear session-based trading levels.
📌 Day traders & scalpers looking to refine their intraday setups.
📌 Smart money traders using liquidity concepts.
📌 Swing traders tracking higher timeframe momentum shifts.
🚀 Final Thoughts
This indicator is an essential tool for traders who want to understand market structure, liquidity, and volatility cycles. Whether you’re trading forex, stocks, or crypto, it helps you stay on the right side of the market and avoid unnecessary risks.
🔹 Set it up, customize your colors, define your UTC offset, and start trading smarter today! 🏆📈

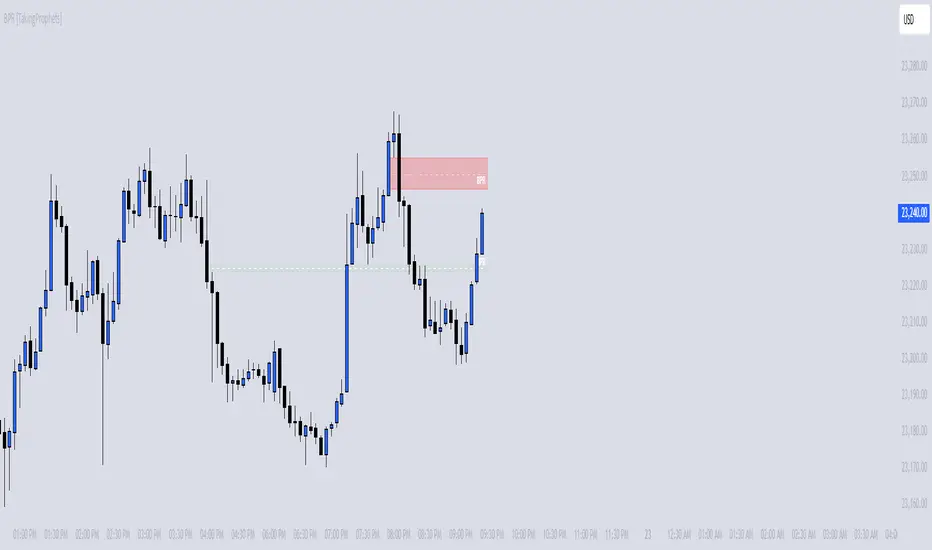
BPR [TakingProphets]The BPR (Balanced Price Range) Indicator by Taking Prophets is built for traders who follow ICT (Inner Circle Trader) concepts and smart money strategies. In ICT methodology, a Balanced Price Range (BPR) occurs when price rapidly moves in one direction, creating an imbalance that often gets revisited before price continues its trend. These areas represent inefficiencies in the market where liquidity was not properly distributed, making them key zones for potential retracements and trade setups.
How the Indicator Works:
🔹 Automatically Detects BPRs – No need to manually mark imbalances; the indicator highlights them for you.
🔹 Helps Identify Smart Money Footprints – Spot areas where price is likely to retrace and rebalance liquidity.
🔹 Customizable Sensitivity – Adjust detection parameters based on your preferred trading style.
🔹 Works Across All Markets – Apply it to Forex, Futures, Crypto, and Stocks on TradingView.
🔹 Clean and Intuitive Interface – Designed to be simple yet powerful for both new and experienced traders.
LRLR [TakingProphets]LRLR (Low Resistance Liquidity Run) Indicator
This indicator identifies potential liquidity runs in areas of low resistance, based on ICT (Inner Circle Trader) concepts. It specifically looks for a series of unmitigated swing highs in a downtrend that form without any bearish fair value gaps (FVGs) between them.
What is an LRLR?
- A Low Resistance Liquidity Run occurs when price creates a series of lower highs without any bearish fair value gaps in between
- The absence of bearish FVGs indicates there is no significant resistance in the area
- These formations often become targets for smart money to collect liquidity above the swing highs
How to Use the Indicator:
1. The indicator will draw a diagonal line connecting a series of qualifying swing highs
2. A small "LRLR" label appears to mark the pattern
3. These areas often become targets for future price moves, as they represent zones of accumulated liquidity with minimal resistance
Key Points:
- Minimum of 4 consecutive lower swing highs
- No bearish fair value gaps can exist between these swing highs
- The diagonal line helps visualize the liquidity run formation
- Can be used for trade planning and identifying potential reversal zones
Settings:
- Show Labels: Toggle the "LRLR" label visibility
- LRLR Line Color: Customize the appearance of the diagonal line
Best Practices:
1. Use in conjunction with other ICT concepts and market structure analysis
2. Pay attention to how price reacts when returning to these levels
3. Consider these areas as potential targets for smart money liquidity grabs
4. Most effective when used on higher timeframes (4H and above)
Note: This is an educational tool and should be used as part of a complete trading strategy, not in isolation.

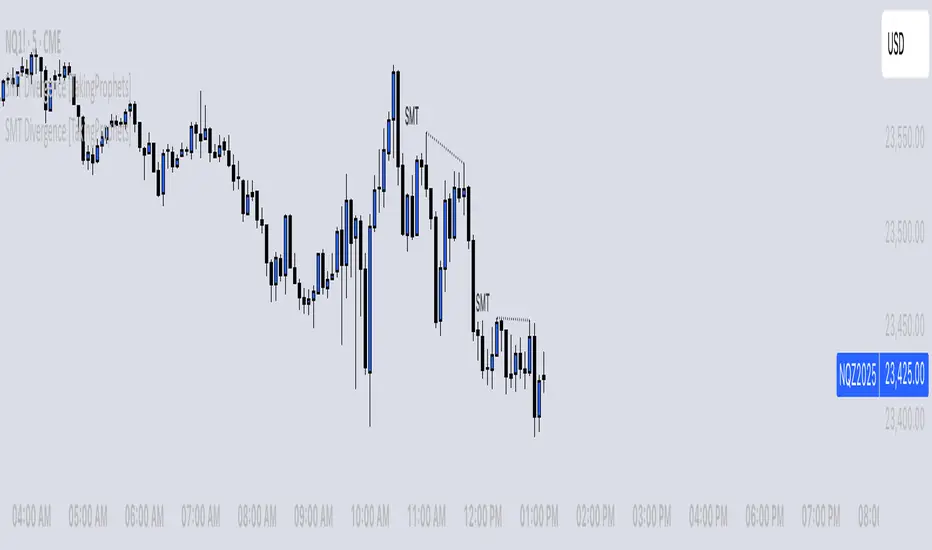
SMT Divergence [TakingProphets]The SMT (Smart Money Technique) Divergence indicator identifies potential market manipulation and smart money footprints by comparing price action between correlated instruments. It uses a dual-detection system to catch both frequent local SMTs and larger structural SMTs:
• Primary detection uses a shorter lookback period (default 5) to identify common SMT patterns
• Secondary detection uses a longer lookback period (default 8) to catch larger structural SMTs
• Automatically filters significant moves to prevent noise
• Labels are placed clearly outside of price action for better visibility
• Toggle between showing all SMTs or only significant liquidity sweeps
Compare any two instruments to spot divergences in their price action. Particularly useful for:
- Futures vs Spot markets
- Related currency pairs
- Index vs its components
- Any correlated instruments
Default settings are optimized for intraday trading but can be adjusted for different timeframes.
Note: This indicator works best when comparing closely correlated instruments and should be used alongside other technical analysis tools.
G&S SMT### Description of the Pine Script
This Pine Script is designed to identify **Smart Money Technique (SMT)** setups between **Gold (GC1!)** and **Silver (SI1!) Futures** on a **15-minute timeframe**. It specifically looks for divergences between the price movements of Gold and Silver over the last 4 candles and compares it with the next candle's price movement. The script provides **Bullish** and **Bearish** signals for SMT during a specified time range of **8:45 AM EST to 10:30 AM EST**.
### Key Features of the Script:
1. **Futures Symbols**:
- The script uses **Gold Futures (GC1!)** and **Silver Futures (SI1!)** on a 15-minute timeframe to monitor their price movements.
2. **Time Range Filtering**:
- The signals are only active between **8:45 AM EST and 10:30 AM EST**, ensuring that the script only signals within the most relevant trading hours for your strategy.
3. **SMT Calculation (Last 4 Candles vs Next Candle)**:
- **Gold and Silver Price Change Calculation**: The script compares the price changes of **Gold** and **Silver** over the **last 4 candles** and then compares them with the price movement of the **next candle**:
- **Bullish SMT**: Occurs when Gold shows an increase in the last 4 candles while Silver shows a decrease, and both Gold and Silver show an increase in the next candle.
- **Bearish SMT**: Occurs when Gold shows a decrease in the last 4 candles while Silver shows an increase, and both Gold and Silver show a decrease in the next candle.
4. **Bullish and Bearish Signals**:
- **Bullish SMT Signal**: The script will plot a **green** arrow below the bar when a Bullish SMT setup is identified.
- **Bearish SMT Signal**: A **red** arrow above the bar is plotted when a Bearish SMT setup is identified.
5. **Gold and Silver Difference Plot**:
- The difference between the prices of **Gold** and **Silver** is plotted as a **blue line**, giving a visual representation of the relationship between the two assets. When the difference line moves significantly, it can indicate a potential divergence or convergence in the prices of Gold and Silver.
### Script Logic Breakdown:
1. **Price Change for Last 4 Candles**:
- The script calculates the price change for Gold and Silver from the 4th-to-last candle to the last candle.
- `gold_change_last4` and `silver_change_last4` calculate these price differences.
2. **Price Change for Next Candle**:
- It then calculates the price change from the last candle to the next candle.
- `gold_change_next` and `silver_change_next` calculate these price differences.
3. **Bullish SMT Condition**:
- If Gold increased while Silver decreased in the last 4 candles, and both Gold and Silver show an increase in the next candle, it indicates a **Bullish SMT**.
4. **Bearish SMT Condition**:
- If Gold decreased while Silver increased in the last 4 candles, and both Gold and Silver show a decrease in the next candle, it indicates a **Bearish SMT**.
5. **Time Filter**:
- Signals are only plotted when the current time is between **8:45 AM EST and 10:30 AM EST** to match your preferred trading hours.
### Visualization:
- **Bullish Signals**: Plotted as **green arrows** below the bars when a Bullish SMT setup is identified.
- **Bearish Signals**: Plotted as **red arrows** above the bars when a Bearish SMT setup is identified.
- **Gold - Silver Difference**: A **blue line** is plotted to show the price difference between Gold and Silver, helping visualize any divergence.
### How It Helps:
- **Divergence Identification**: This script highlights potential divergences between Gold and Silver Futures, which can provide insights into market sentiment and smart money movements.
- **Focus on Relevant Time Frame**: By filtering signals between 8:45 AM EST and 10:30 AM EST, you are focusing on a timeframe that can be more beneficial for trading.
- **Visual Clarity**: The arrows and the price difference line provide clear signals and a visual representation of the relationship between Gold and Silver, helping you make informed trading decisions.
This script is an automated approach to detecting **SMT setups** and helping traders recognize when Gold and Silver might be signaling a bullish or bearish move based on their divergence patterns.

Enhanced London Session SMC SetupEnhanced London Session SMC Setup Indicator
This Pine Script-based indicator is designed for traders focusing on the London trading session, leveraging smart money concepts (SMC) to identify potential trading opportunities in the GBP/USD currency pair. The script uses multiple techniques such as Order Block Detection, Imbalance (Fair Value Gap) Analysis, Change of Character (CHoCH) detection, and Fibonacci retracement levels to aid in market structure analysis, providing a well-rounded approach to trade setups.
Features:
London Session Highlight:
The indicator visually marks the London trading session (from 08:00 AM to 04:00 PM UTC) on the chart using a blue background, signaling when the high-volume, high-impulse moves tend to occur, helping traders focus their analysis on this key session.
Order Block Detection:
Identifies significant impulse moves that may form order blocks (supply and demand zones). Order blocks are areas where institutions have executed large orders, often leading to price reversals or continuation. The indicator plots the high and low of these order blocks, providing key levels to monitor for potential entries.
Imbalance (Fair Value Gap) Detection:
Detects and highlights price imbalances or fair value gaps (FVG) where the market has moved too quickly, creating a gap in price action. These areas are often revisited by price, offering potential trade opportunities. The upper and lower bounds of the imbalance are visually marked for easy reference.
Change of Character (CHoCH) Detection:
This feature identifies potential trend reversals by detecting significant changes in market character. When the price action shifts from bullish to bearish or vice versa, a CHoCH signal is triggered, and the corresponding level is marked on the chart. This can help traders catch trend reversals at key levels.
Fibonacci Retracement Levels:
The script calculates and plots the key Fibonacci retracement levels (0.618 and 0.786 by default) based on the highest and lowest points over a user-defined swing lookback period. These levels are commonly used by traders to identify potential pullback zones where price may reverse or find support/resistance.
Directional Bias Based on Market Structure:
The indicator provides a market structure analysis by comparing the current highs and lows to the previous periods' highs and lows. This helps in identifying whether the market is in a bullish or bearish state, providing a clear directional bias for trade setups.
Alerts:
The indicator comes with built-in alert conditions to notify the trader when an order block, imbalance, CHoCH, or other significant price action event is detected, ensuring timely action can be taken.
Ideal Usage:
Timeframe: Suitable for intraday trading, particularly focusing on the London session (08:00 AM to 04:00 PM UTC).
Currency Pair: Specifically designed for GBP/USD but can be adapted to other pairs with similar market behavior.
Trading Strategy: Best used in conjunction with a price action strategy, focusing on the key levels identified (order blocks, FVG, CHoCH) and using Fibonacci retracement levels for precision entries.
Target Audience: Ideal for traders who follow smart money concepts (SMC) and are looking for a structured approach to identify high-probability setups during the London session.

Price Action Toolkit Lite [UAlgo]The Price Action Toolkit Lite is a comprehensive indicator designed to enhance your chart analysis with advanced price action tools. This powerful toolkit combines multiple technical analysis concepts to provide traders with a clear visualization of market structure, liquidity levels, order blocks, and trend lines. By integrating these elements, the indicator aims to offer a holistic view of price action, helping traders identify potential entry and exit points, as well as key levels of interest in the market.
🔶 Key Features
Market Structure Analysis: The indicator includes a ZigZag feature to highlight significant market highs and lows, aiding in the visualization of market structure changes and trends.
Liquidity Sweeps Detection: It identifies and displays liquidity sweeps, which are crucial for recognizing potential market reversals and areas of interest where significant price action is likely to occur.
Order Blocks: Automatically detects and draws order blocks, highlighting areas of institutional buying and selling pressure, which can serve as key support and resistance levels.
Trend Lines: The toolkit can draw and extend trend lines based on pivot points, providing a clear view of prevailing market trends and potential breakout points.
Customizable Settings: Users can adjust various settings, including the length of the ZigZag, liquidity detection sensitivity, the number of order blocks to display, and trend line detection parameters, allowing for a tailored analysis experience.
🔶 Disclaimer
The "Price Action Toolkit Lite " is intended for educational and informational purposes only.
It is not financial advice and should not be construed as such. Trading in financial markets involves substantial risk, including the risk of loss.
Past performance is not indicative of future results.
🔷 Similar Scripts

Hourly Opening PriceThe Inner Circle Trader has noted that the Opening Price of every Hourly candle can be used in a Power Of 3 (PO3) context.
If Bullish, buy BELOW the hourly open.
If Bearish, sell ABOVE the hourly open.
The Power of 3 ICT model also know as "AMD" is a transformative trading strategy, ingeniously designed to streamline your time analyzing charts by focusing on three pivotal phases in market behavior: accumulation, manipulation, and distribution.
The ICT Power of Three Model dissects the market maker’s algorithm for price delivery into three pivotal actions: Accumulation, Manipulation, and Distribution. Accumulation involves smart money gathering positions before a price surge, while manipulation sees the market creating deceptive movements to trigger stops. Finally, distribution occurs as smart money offloads positions, often catching less informed traders off-guard. This strategy is a critical tool for traders to understand market makers’ maneuvers and to strategically position themselves in the market.
This indicator plots a line at the opening price of each hour and extends it on the chart for the duration of the hour. Each hour starts a new line.
You also have the option of extending the midnight opening price line across the entire trading day.

ICT Immediate Rebalance Toolkit [LuxAlgo]The ICT Immediate Rebalance Toolkit is a comprehensive suite of tools crafted to aid traders in pinpointing crucial trading zones and patterns within the market.
The ICT Immediate Rebalance, although frequently overlooked, emerges as one of ICT's most influential concepts, particularly when considered within a specific context. The toolkit integrates commonly used price action tools to be utilized in conjunction with the Immediate Rebalance patterns, enriching the capacity to discern context for improved trading decisions.
The ICT Immediate Rebalance Toolkit encompasses the following Price Action components:
ICT Immediate Rebalance
Buyside/Sellside Liquidity
Order Blocks & Breaker Blocks
Liquidity Voids
ICT Macros
🔶 USAGE
🔹 ICT Immediate Rebalance
What is an Immediate Rebalance?
Immediate rebalances, a concept taught by ICT, hold significant importance in decision-making. To comprehend the concept of immediate rebalance, it's essential to grasp the notion of the fair value gap. A fair value gap arises from market inefficiencies or imbalances, whereas an immediate rebalance leaves no gap, no inefficiencies, or no imbalances that the price would need to return to.
Rule of Thumb
After an immediate rebalance, the expectation is for two extension candles to follow; otherwise, the immediate rebalance is considered failed. It's important to highlight that both failed and successful immediate rebalances, when considered within a context, are significant signatures in trading.
Immediate rebalances can occur anywhere and in any timeframe.
🔹 Buyside/Sellside Liquidity
In the context of Inner Circle Trader's teachings, liquidity primarily refers to the presence of stop losses or pending orders, that indicate concentrations of buy or sell orders at specific price levels. Institutional traders, like banks and large financial entities, frequently aim for these liquidity levels or pools to accumulate or distribute their positions.
Buyside liquidity denotes a chart level where short sellers typically position their stops, while Sellside liquidity indicates a level where long-biased traders usually place their stops. These zones often serve as support or resistance levels, presenting potential trading opportunities.
The presentation applied here is the multi-timeframe version of our previously published Buyside-Sellside-Liquidity script.
🔹 Order Blocks & Breaker Blocks
Order Blocks and Breaker Blocks hold significant importance in technical analysis and play a crucial role in shaping market behavior.
Order blocks are fundamental elements of price action analysis used by traders to identify key levels in the market where significant buying or selling activity has occurred. These blocks represent areas on a price chart where institutional traders, banks, or large market participants have placed substantial buy or sell orders, leading to a temporary imbalance in supply and demand.
Breaker blocks, also known as liquidity clusters or pools, complement order blocks by identifying zones where liquidity is concentrated on the price chart. These areas, formed from mitigated order blocks, often act as significant barriers to price movement, potentially leading to price stalls or reversals in the future.
🔹 Liquidity Voids
Liquidity voids are sudden price changes when the price jumps from one level to another. Liquidity voids will appear as a single or a group of candles that are all positioned in the same direction. These candles typically have large real bodies and very short wicks, suggesting very little disagreement between buyers and sellers.
Here is our previously released Liquidity-Voids script.
🔹 ICT Macros
In the context of ICT's teachings, a macro is a small program or set of instructions that unfolds within an algorithm, which influences price movements in the market. These macros operate at specific times and can be related to price runs from one level to another or certain market behaviors during specific time intervals. They help traders anticipate market movements and potential setups during specific time intervals.
Here is our previously released ICT-Macros script.
🔶 SETTINGS
🔹 Immediate Rebalances
Immediate Rebalances: toggles the visibility of the detected immediate rebalance patterns.
Bullish, and Bearish Immediate Rebalances: color customization options.
Wicks 75%, %50, and %25: color customization options of the wick price levels for the detected immediate rebalance.
Ignore Price Gaps: ignores price gaps during calculation.
Confirmation (Bars): specifies the number of bars required to confirm the validation of the detected immediate rebalance.
Immediate Rebalance Icon: allows customization of the size of the icon used to represent the immediate rebalance.
🔹 Buyside/Sellside Liquidity
Buyside/Sellside Liquidity: toggles the visibility of the buy-side/sell-side liquidity levels.
Timeframe: this option is to identify liquidity levels from higher timeframes. If a timeframe lower than the chart's timeframe is selected, calculations will be based on the chart's timeframe.
Detection Length: lookback period used for the detection.
Margin: sets margin/sensitivity for the liquidity levels.
Buyside/Sellside Liquidity Color: color customization option for buy-side/sell-side liquidity levels.
Visible Liquidity Levels: allows customization of the visible buy-side/sell-side liquidity levels.
🔹 Order Blocks & Breaker Blocks
Order Blocks: toggles the visibility of the order blocks.
Breaker Blocks: toggles the visibility of the breaker blocks.
Swing Detection Length: lookback period used for the detection of the swing points used to create order blocks & breaker blocks.
Mitigation Price: allows users to select between the closing price or the wick of the candle.
Use Candle Body in Detection: allows users to use candle bodies as order block areas instead of the full candle range.
Remove Mitigated Order Blocks & Breaker Blocks: toggles the visibility of the mitigated order blocks & breaker blocks.
Order Blocks: Bullish, Bearish Color: color customization option for order blocks.
Breaker Blocks: Bullish, Bearish Color: color customization option for breaker blocks.
Visible Order & Breaker Blocks: allows customization of the visible order & breaker blocks.
Show Order Blocks & Breaker Blocks Labels: toggles the visibility of the order blocks & breaker blocks labels.
🔹 Liquidity Voids
Liquidity Voids: toggles the visibility of the liquidity voids.
Liquidity Voids Width Filter: filtering threshold while detecting liquidity voids.
Ignore Price Gaps: ignores price gaps during calculation.
Remove Mitigated Liquidity Voids: remove mitigated liquidity voids.
Bullish, Bearish, and Mitigated Liquidity Voids: color customization option..
Liquidity Void Labels: toggles the visibility of the liquidity voids labels.
🔹 ICT Macros
London and New York (AM, Launch, and PM): toggles the visibility of specific macros, allowing users to customize macro colors.
Macro Top/Bottom Lines, Extend: toggles the visibility of the macro's pivot high/low lines and allows users to extend the pivot lines.
Macro Mean Line: toggles the visibility of the macro's mean (average) line.
Macro Labels: toggles the visibility of the macro labels, allowing customization of the label size.
🔶 RELATED SCRIPTS
ICT-Killzones-Toolkit
Smart-Money-Concepts
Thanks to our community for recommending this script. For more conceptual scripts and related content, we welcome you to explore by visiting >>> LuxAlgo-Scripts .

COT Index Commercials vs large and small SpeculatorsThe COT reports for futures-only Commitments of Traders and for Futures and Options Combined Commitments of Traders are collected on Tuesdays and published every Friday at 3:30 p.m. Eastern time. The raw data is available free of charge on the Commodity Futures Trading Commission (CFTC) website.
Use it to get a better understanding on which side the smart money (producers, commercials) are trading on.
The COT index ranges from 0 to 100%. Extreme values are areas below 25% and above 75%. When the index reaches 0% or 100%, it means that the market participant has the most extreme net short or net long position in the last 26 weeks. Readings below 25% are considered as a short sentiment and readings above 75% are considered long sentiment. However the COT index is not a timing tool. It only shows the overall market sentiment of the smart money in relation over the past 26 weeks.
You can change the period to calculate the index, as well as the style, which lines to show and if you want to highlight the extreme arias.

ICT Concept [TradingFinder] Order Block | FVG | Liquidity Sweeps🔵 Introduction
The "ICT" style is one of the subsets of "Price Action" technical analysis. ICT is a method created by "Michael Huddleston", a professional forex trader and experienced mentor. The acronym ICT stands for "Inner Circle Trader".
The main objective of the ICT trading strategy is to combine "Price Action" and the concept of "Smart Money" to identify optimal entry points into trades. However, finding suitable entry points is not the only strength of this approach. With the ICT style, traders can better understand price behavior and adapt their trading approach to market structure accordingly.
Numerous concepts are discussed in this style, but the key practical concepts for trading in financial markets include "Order Block," "Liquidity," and "FVG".
🔵 How to Use
🟣Order Block
Order blocks are a specific type of "Supply and Demand" zones formed when a series of orders are placed in a block. These orders could be created by banks or other major players. Banks typically execute large orders in blocks during their trading sessions. If they were to enter the market directly with a small quantity, significant price movements would occur before the orders are fully executed, resulting in less profit. To avoid this, they divide their orders into smaller, manageable positions. Traders should look for "buy" opportunities in "demand order blocks" areas and "sell" opportunities in "supply order blocks".
🟣Liquidity
These levels are where traders aim to exit their trades. "Market Makers" or smart money usually collects or distributes their trading positions near levels where many retail traders have placed their "Stop Loss" orders. When the liquidity resulting from these losses is collected, the price often reverses direction.
A "Stop Hunt" is a move designed to neutralize liquidity generated by triggered stop losses. Banks often use significant news events to trigger stop hunts and acquire the liquidity released in the market. If, for example, they intend to execute heavy buy orders, they encourage others to sell through stop hunts.
As a result, if there is liquidity in the market before reaching the order block region, the credibility of that order block is higher. Conversely, if liquidity is near the order block, meaning the price reaches the order block before reaching the liquidity area, the credibility of that order block is lower.
🟣FVG (Fair Value Gap)
To identify the "Fair Value Gap" on the chart, one must analyze candle by candle. Focus on candles with large bodies, examining one candle and the one before it. The candles before and after this central candle should have long shadows, and their bodies should not overlap with the body of the central candle. The distance between the shadows of the first and third candles is called the FVG range.
These zone function in two ways :
•Supply and Demand zone: In this case, the price reacts to these zone, and its trend reverses.
•Liquidity zone: In this scenario, the price "fills" the zone and then reaches the order block.
Important Note: In most cases, FVG zone with very small width act as supply and demand zone, while zone with a significant width act as liquidity zone, absorbing the price.
🔵 Setting
🟣Order Block
Refine Order Block : When the option for refining order blocks is Off, the supply and demand zones encompass the entire length of the order block (from Low to High) in their standard state and remain unaltered. On the option for refining order blocks triggers the improvement of supply and demand zones using the error correction algorithm.
Refine Type : The enhancement of order blocks via the error correction algorithm can be executed through two methods: Defensive and Aggressive. In the Aggressive approach, the widest possible range is taken into account for order blocks.
Show High Levels : If major high levels are to be displayed, set the option for showing high level to Yes.
Show Low Levels : If major low levels are to be displayed, set the option for showing low level to Yes.
Show Last Support : If showing the last support is desired, set the option for showing last support to Yes.
Show Last Resistance : If showing the last resistance is desired, set the option for showing last resistance to Yes.
🟣 FVG
FVG Filter : When FVG filtering is activated, the number of FVG areas undergoes filtration based on the specified algorithm.
FVG Filter Types :
1. Very Aggressive : Apart from the initial condition, an additional condition is introduced. For an upward FVG, the maximum price of the last candle should exceed the maximum price of the middle candle. Similarly, for a downward FVG, the minimum price of the last candle should be lower than the minimum price of the middle candle. This mode eliminates a minimal number of FVGs.
2. Aggressive : In addition to the conditions of the Very Aggressive mode, this mode considers the size of the middle candle; it should not be small. Consequently, a larger number of FVGs are eliminated in this mode.
3. Defensive : Alongside the conditions of the Very Aggressive mode, this mode takes into account the size of the middle candle, which should be relatively large with the majority of it comprising the body. Furthermore, to identify upward FVGs, the second and third candles must be positive, whereas for downward FVGs, the second and third candles must be negative. This mode filters out a considerable number of FVGs, retaining only those of suitable quality.
4. Very Defensive : In addition to the conditions of the Defensive mode, the first and third candles should not be very small-bodied doji candles. This mode filters out the majority of FVGs, leaving only the highest quality ones. Show Demand FVG: Enables the display of demand-related boxes, which can be toggled between off and on. Show Supply FVG: Enables the display of supply-related boxes along the path, which can also be toggled between off and on.
🟣 Liquidity
Statics Liquidity Line Sensitivity : A value ranging from 0 to 0.4. Increasing this value reduces the sensitivity of the "Statics Liquidity Line Detection" function and increases the number of identified lines. The default value is 0.3.
Dynamics Liquidity Line Sensitivity : A value ranging from 0.4 to 1.95. Increasing this value enhances the sensitivity of the "Dynamics Liquidity Line Detection" function and decreases the number of identified lines. The default value is 1.
Statics Period Pivot : Default value is set to 8. By adjusting this value, you can specify the period for static liquidity line pivots.
Dynamics Period Pivot : Default value is set to 3. By adjusting this value, you can specify the period for dynamic liquidity line pivots.
You can activate or deactivate liquidity lines as necessary using the buttons labeled "Show Statics High Liquidity Line," "Show Statics Low Liquidity Line," "Show Dynamics High Liquidity Line," and "Show Dynamics Low Liquidity Line".

ICT Killzones Toolkit [LuxAlgo]The ICT Killzones Toolkit is a comprehensive set of tools designed to assist traders in identifying key trading zones and patterns within the market.
The ICT Killzones Toolkit includes the following Price Action components:
ICT Killzones with Pivot Highs/Lows
Order Blocks
Breaker Blocks
Fair Value Gaps
Market Structure Shifts
By combining these components, the ICT Killzones Toolkit provides traders with a comprehensive framework for analyzing the market and identifying setups of interest. Leveraging these tools effectively can enhance traders' decision-making process and improve killzones interpretability.
🔶 USAGE
In forex/futures trading, timing is crucial. ICT Killzone are specific periods when there's a higher chance of finding setups of interest. Mastering these time intervals can offer significant advantages to traders who know how to use them effectively.
The image above highlights a potential setup of interest when using the ICT Killzones Toolkit.
As another example for utilizing the ICT Killzones Toolkit, we can see in the image above when price retests setups generated from killzones such as Order Blocks or Fair Value Gaps, a potential strategy could be to look for entries on those & take profits as the next killzone appears.
🔹 Order Blocks
Order Blocks are sections on a price chart where notable buying or selling activity has occured, often signaling interest zones for institutional traders. This toolkit's Order Blocks component pinpoints these areas within the Killzone, which may act as potential support or resistance levels.
🔹 Breaker Blocks
Breaker Blocks are zones built from mitigated order blocks, and highlight zones on the chart where price has previously stalled or reversed. These areas may act as significant barriers to price movement in the future, and the Breaker Blocks component helps traders identify them for potential trading opportunities.
🔹 Fair Value Gaps
Fair value gaps are especially favored by price action traders and arise from market inefficiencies or imbalances, typically when buying and selling are unequal. These gaps often attract price movement before resuming in the same direction. the Fair Value Gaps component of the toolkit helps traders identify and analyze them.
🔹 Market Structure Shifts
Market Structure Shifts refer to significant changes in the overall structure of the market, such as shifts in trend direction, volatility, or trading activity. These shifts can provide valuable insights into market sentiment and potential trading opportunities, and the Market Structure Shifts component helps traders identify and interpret them.
Overall, the ICT Killzone Toolkit combines these components to provide traders with a comprehensive framework for analyzing the markets and identifying high-probability trading setups.
🔶 SETTINGS
🔹 ICT Killzones
Asian, London Open, New York, and London Close: toggles the visibility of specific Killzones, allowing users to customize time periods and Killzone colors.
Killzone Lines : Top/Bottom, Mean and Extend Top/Bottom: toggles the visibility of the Killzone's pivot high and low lines, mean (average) line, and allows users to extend the pivot lines.
Killzone Labels: Toggles the visibility of the Killzone labels.
Display Killzones within Timeframes Up To: Toggles the visibility of the Killzones up to selected Timeframes.
Open Price, Separator, Label, and Color: toggles the visibility of the open price of the Killzones or for the day, week, or month. If the day, week, or month is selected, a separator will be displayed to highlight the beginning of each respective period. Additionally, users can customize the color and toggle the label as needed.
🔹 Order Blocks & Breaker Blocks
Order Blocks | Breaker Blocks: toggles the visibility of the order blocks & breaker blocks.
Swing Detection Length: lookback period used for the detection of the swing points used to create order blocks & breaker blocks.
Mitigation Price: allows users to select between closing price or wick of the candle.
Use Candle Body in Detection: allows users to use candle bodies as order block areas instead of the full candle range.
Remove Mitigated Order Blocks & Breaker Blocks: toggles the visibility of the mitigated order blocks & breaker blocks.
Extend Order Blocks & Breaker Blocks: enables processing of the order blocks & breaker blocks beyond the boundaries of the killzones.
Display Order Blocks & Breaker Blocks: enables the display of the first, last, or all occurrences of the order blocks & breaker blocks.
Order Blocks : Bullish, Bearish Color: color customization option for order blocks.
Breaker Blocks : Bullish, Bearish Color: color customization option for breaker blocks.
Show Order Blocks & Breaker Blocks Text: toggles the visibility of the order blocks & breaker blocks labels.
🔹 Market Structure Shifts
Market Structure Shifts: toggles the visibility of the market structure shifts.
Detection Length: market structure shift detection length.
Display Market Structure Shifts: enables the display of the first, last, or all occurrences of the market structure shifts.
Market Structure Shifts : Bullish, Bearish Color: color custumization option for market structure shifts.
Show Market Structure Shifts Text: toggles the visibility of the market structure shifts labels.
🔹 Fair Value Gaps
Fair Value Gaps: toggles the visibility of the fair value gaps.
Fair Value Gap Width Filter: filtering threshold wile detecting fair value gaps.
Remove Mitigated Fair Value Gaps: removes mitigated fair value gaps.
Extend Fair Value Gaps: enables processing of the fair value gaps beyond the boundaries of the killzones.
Display Fair Value Gaps: enables the display of the first, last, or all occurrences of the fair value gaps.
Bullish Imbalance Color: color customization option.
Bearish Imbalance Color: color customization option.
Show Fair Value Gaps Text: toggles the visibility of the fair value gaps labels.
🔶 RELATED SCRIPTS
Smart-Money-Concepts
Order-Blocks-Breaker-Blocks
Thanks to our community for recommending this script. For more conceptual scripts and related content, we welcome you to explore by visiting >>> LuxAlgo-Scripts .

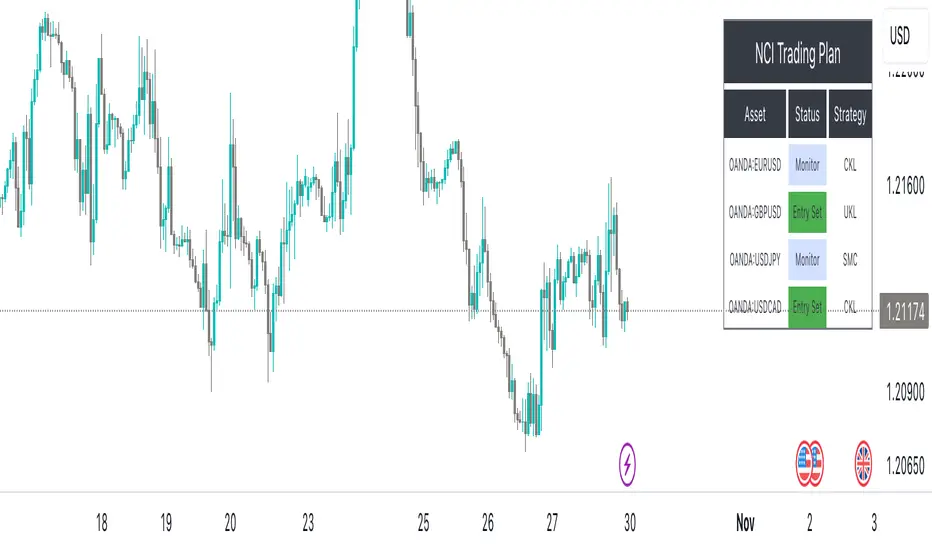
NCI Trading Plan (Individual Asset)NCI Trading Plan (Individual Asset)- By LightNCI
NCI, which stands for New Concept Integration by Jayce PHAM, is a comprehensive approach that incorporates various critical aspects of trading to provide a logical, structured, and integrated approach to the financial markets. NCI covers market structure, key levels, smart money concepts, multiple timeframes and market cycles
About the NCI Trading Plan (Individual Asset) Indicator
The NCI Trading Plan is just a table allowing traders to keep track of a single asset, but multiple timeframe status on a single table, ensuring a comprehensive overview of trading statuses and strategies for each timeframe. The status is not automatically update. Using the NCI strategy, you may update it yourself the status of each timeframe.
Features
1. Display column for Daily, H4, H1, M15, M5, M1: Designed to support multi-timeframe analysis.
2. Direction Status Indication: Visualise the direction of each timeframe.
3. Dynamic Status Indication: Visualize the trading status for each asset:
i. Monitor: Asset is under review or surveillance.
ii. Confirmation: A potential trading signal or setup is being confirmed.
iii. Entry Set: An order for the asset has been placed.
iv. Forward-Test: An asset under monitored for it to being forward test.
4. Strategy Indication: Each asset can be tagged with a specific strategy identifier:
i. CKL: Confluence Key Level
ii. UKL: Un-Confluence Key Level
iii. SMC: Smart Money Concept
iv. BRT: Break & Re-Test
v. RTNKL: Re-Test of New Key Level
5. Stylisation: Color-code the statuses, table and fonts to suit your visual preference.
How to use
1. Asset Name: Select asset from the list
2. Timeframe Direction: Choose direction for each timeframe.
3. Status Selection: Choose the current trading status for each asset.
4. Strategy Selection: Assign a trading strategy to each asset.
5. Style: Customise the appearance of your trading plan by selecting preferred colours for different statuses and headers.
Conclusion
The NCI Trading Plan ensures a systematic and organised approach to multi-time frame trading. By maintaining a visual overview of multi-time frame analysis and their corresponding trading statuses and strategies, traders can efficiently manage their portfolio and ensure timely decision-making.
Tip: To reset or modify an asset's status or strategy, simply adjust the settings in the panel on the left. The table will update in real-time.
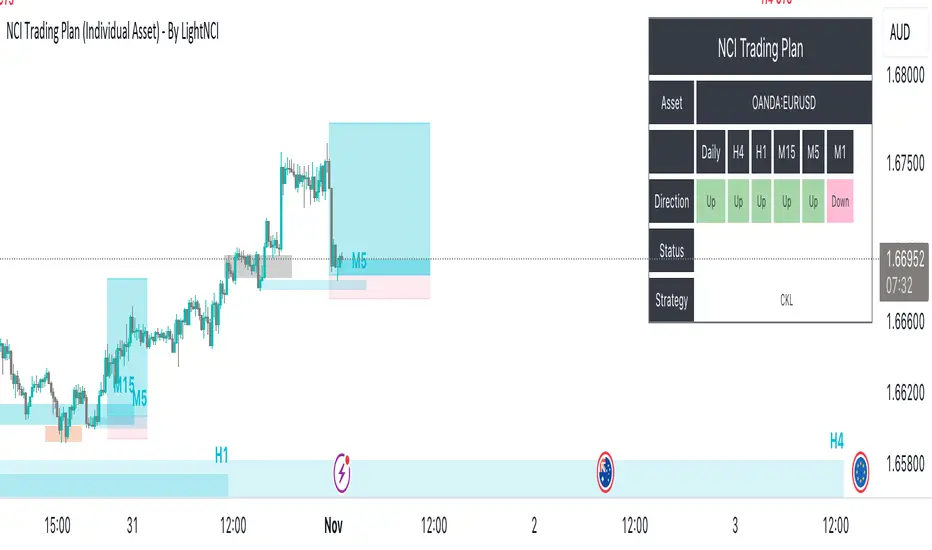
NCI Trading Plan - By LightNCINCI Trading Plan - By LightNCI
NCI, which stands for New Concept Integration by Jayce PHAM, is a comprehensive approach that incorporates various critical aspects of trading to provide a logical, structured, and integrated approach to the financial markets. NCI covers market structure, key levels, smart money concepts, multiple timeframes and market cycles
About the NCI Trading Plan Indicator
The NCI Trading Plan is just a table allowing traders to keep track of multiple assets on a single chart, ensuring a comprehensive overview of trading statuses and strategies for each asset. The status is not automatically update. Using the NCI strategy, you may update it yourself the status of each asset.
Features
1. Display up to 10 different assets: Designed to support multi-asset trading strategies.
2. Dynamic Status Indication: Visualize the trading status for each asset:
i. Monitor: Asset is under review or surveillance.
ii. Confirmation: A potential trading signal or setup is being confirmed.
iii. Entry Set: An order for the asset has been placed.
iv. Forward-Test: An asset under monitored for it to being forward test.
3. Strategy Indication: Each asset can be tagged with a specific strategy identifier:
i. CKL: Confluence Key Level
ii. UKL: Un-Confluence Key Level
iii. SMC: Smart Money Concept
iv. BRT: Break & Re-Test
v. RTNKL: Re-Test of New Key Level
4. Customisable Display: Choose which assets you wish to display with a simple toggle on/off feature.
5. Stylisation: Color-code the statuses, table and fonts to suit your visual preference.
How to use
1. Toggle Display: Use the "Show Asset" checkboxes to determine which assets are visible.
2. Asset Name: Assign a name or symbol to each asset.
3. Status Selection: Choose the current trading status for each asset.
4. Strategy Selection: Assign a trading strategy to each asset.
5. Style: Customise the appearance of your trading plan by selecting preferred colours for different statuses and headers.
Conclusion
The NCI Trading Plan ensures a systematic and organised approach to multi-asset trading. By maintaining a visual overview of various assets and their corresponding trading statuses and strategies, traders can efficiently manage their portfolio and ensure timely decision-making.
Tip: To reset or modify an asset's status or strategy, simply adjust the settings in the panel on the left. The table will update in real-time.